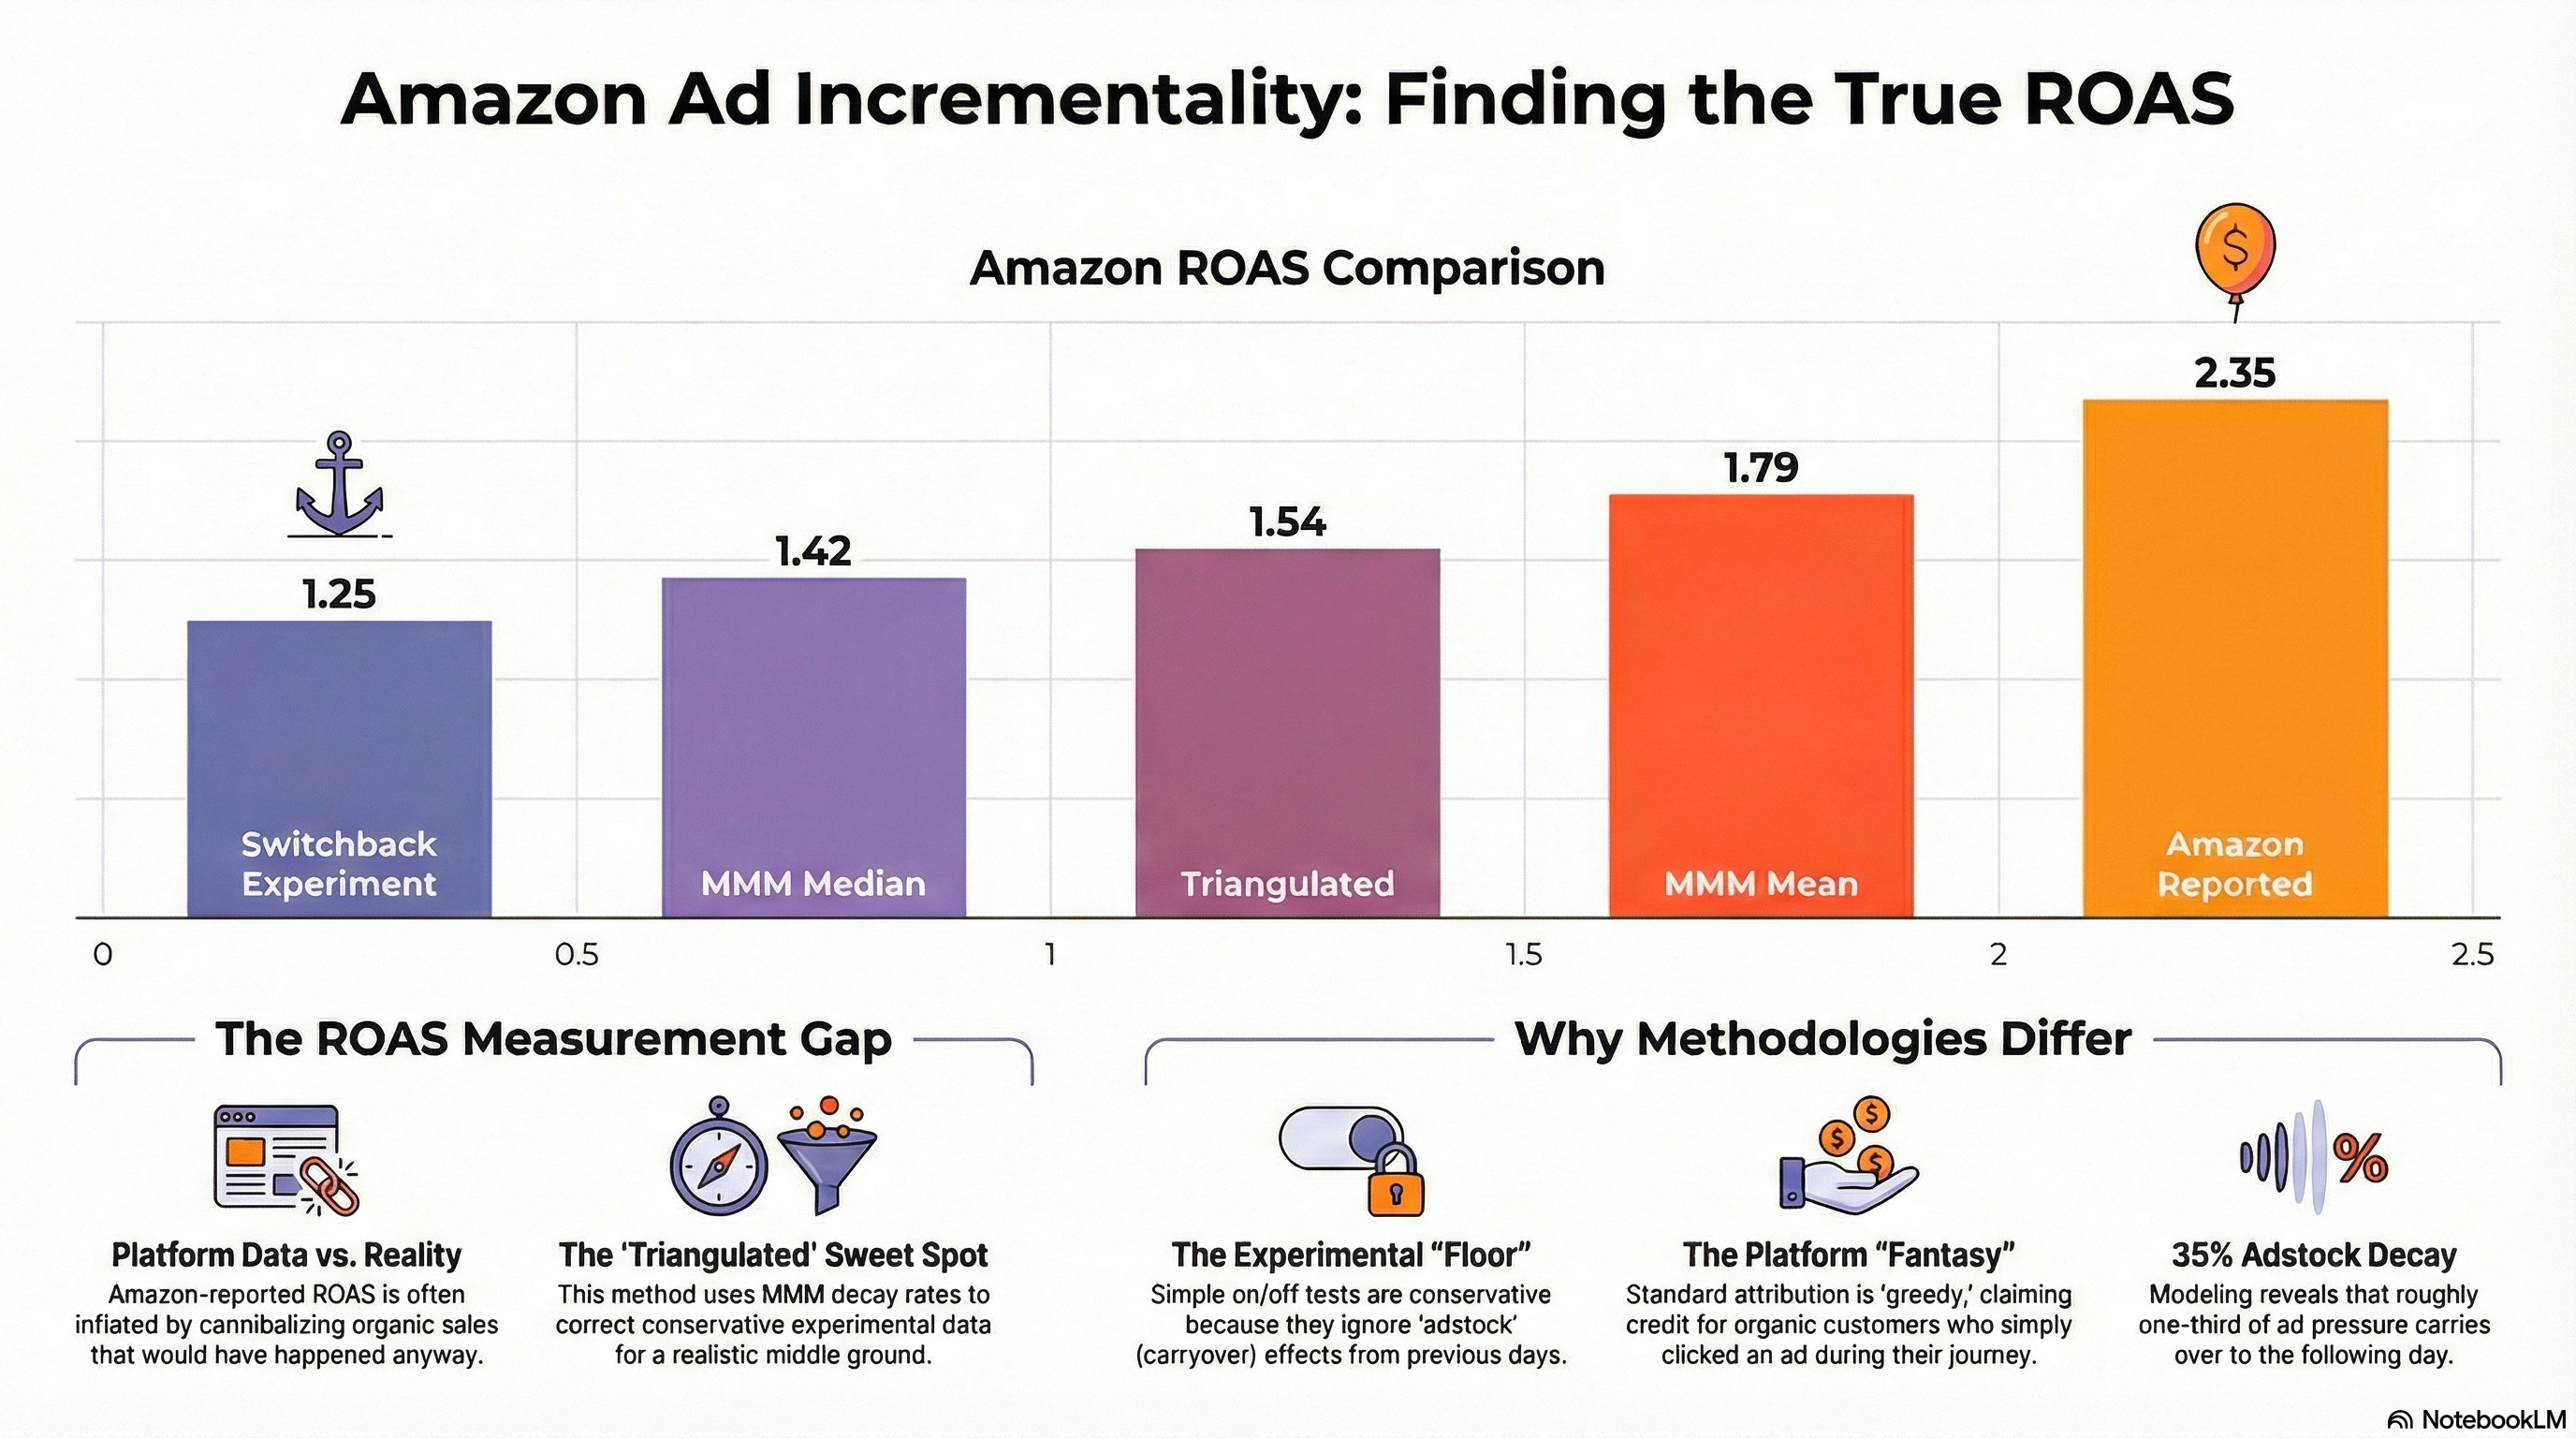
If you are a massive seller on Amazon, measuring ad effectiveness is easy. You pay for Amazon Marketing Cloud, run user-level holdout tests, or deploy geo-segmentation experiments to see exactly how much incremental revenue your ads are driving.
But I am a smaller seller, at about $20k annual ad spend. I don’t have access to those enterprise tools, yet I have the same burning question they do: are my ads actually driving new sales, or am I just paying to convert people who would have bought anyway?
To find out, I combined a manual switchback experiment with marketing mix modeling. The result wasn’t just a number; it was a lesson in how different data views can triangulate the truth.
Level 1: the platform “truth”
If I simply log into Amazon Seller Central and look at my campaign performance, the numbers look great. Ad-attributed sales difference of ~$129 between on and off days, ad spend difference of ~$55, giving a platform ROAS of ~2.35.
If I believed this number, I would be printing money. But Amazon attribution is greedy: it often claims credit for organic sales just because a user clicked an ad at some point in their journey. I suspected 2.35 was heavily inflated by cannibalization.
Level 2: the naive switchback
To find the real lift, I designed a switchback experiment, alternating my ads on and off daily for about a month. The logic is simple: I don’t care what Amazon says the ads did. I only care if my total sales actually went up when the ads were on.
Average daily spend difference was ~$55, average daily sales difference was ~$68.56, giving an incremental ROAS of 1.25.
The drop from 2.35 to 1.25 is brutal. A 1.25 ROAS means that for every $1.00 I spend I only get $0.25 in incremental revenue on top. Once you factor in shipping, cost of goods, and Amazon fees, a 1.25 ROAS is actually a loss. If I stopped here, the logical decision would be to shut off ads entirely.
But this method is too conservative. A daily switchback assumes marketing has zero memory, that an ad clicked on Monday only drives sales on Monday. In reality there is leakage from day to day. My experiment was giving organic credit for some sales that ads actually initiated. I knew 1.25 was likely my performance floor, but I needed to measure that invisible carryover.
Level 3: the marketing mix model
To capture the delayed effect, I fed my experimental data into Google Meridian, an open-source marketing mix model. Unlike a manual spreadsheet, Meridian uses Bayesian statistics to estimate how ad spend drives incremental sales over time.
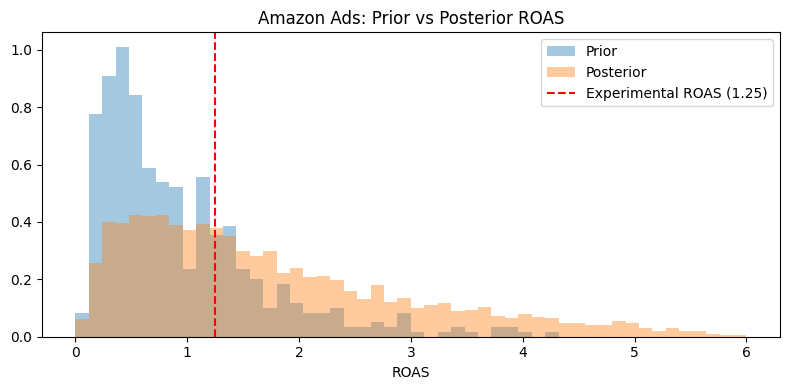
The model found an adstock decay of ~0.35, meaning about 35% of ad pressure bleeds into the next day. Its posterior median ROAS was 1.42 and the mean 1.79, with a 90% credible interval of 0.27 to 4.57. The switchback experiment had a fairly wide confidence interval, but the credible interval for the MMM was wider still. It suggests the true ROAS is higher than 1.25, but it is too fuzzy to bank on.
Level 4: triangulation
This is where it got interesting. I could combine the experiment with the model, using the model’s structural insight (the 0.35 decay rate) to update the experiment’s math.
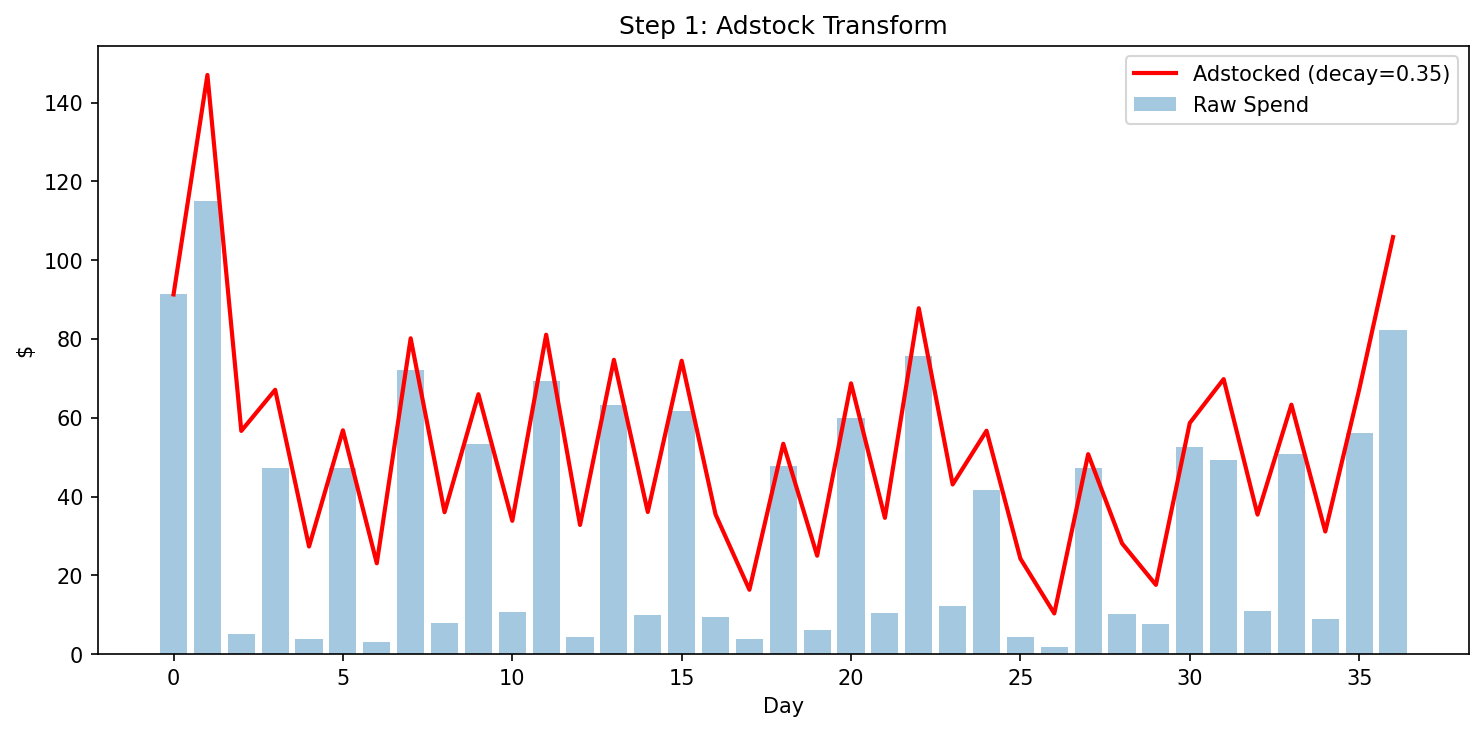
In my original calculation I divided the sales lift by the difference in spend. But because of that decay rate, the difference in actual ad pressure on any given day wasn’t $55. It was $44.43, because off days still carried leftover pressure from previous on days.
Average adstock on treatment days was $74.72 against $30.29 on control days, a difference of $44.43. Dividing the same $68.56 sales lift by that adjusted figure gives an adstock-adjusted ROAS of 1.54.
Conclusion: trusting the 1.54
This result is lower than the platform fantasy of 2.35, higher than the zero-decay switchback estimate of 1.25, and lands neatly between the model’s median of 1.42 and mean of 1.79. By triangulating these methods, I have far more confidence in the incremental sales driven by ad spend on Amazon.
For small sellers the lesson is clear: you don’t need a $50k tech stack. You need a simple on/off test to anchor your data, an open-source model to estimate the decay, and a calculator to bridge the gap.

Senior data scientist and PhD economist specializing in experimentation and observational causal inference. Previously Uber, Airbnb, Stripe, the Federal Reserve, and the SEC. More about my background.
New write-ups when I finish them
I simulate a method, run it against known ground truth, and publish what happened. No schedule, and no filler between posts.
Unsubscribe anytime.