In a previous discussion we identified how repeatedly checking experiment results inflates false positive rates. Each peek is a new opportunity to mistake random noise for a win. Simulations show that peeking daily over a 30-day experiment inflates your false positive rate from an intended 5% to 26%.
The simulation: measuring the risk
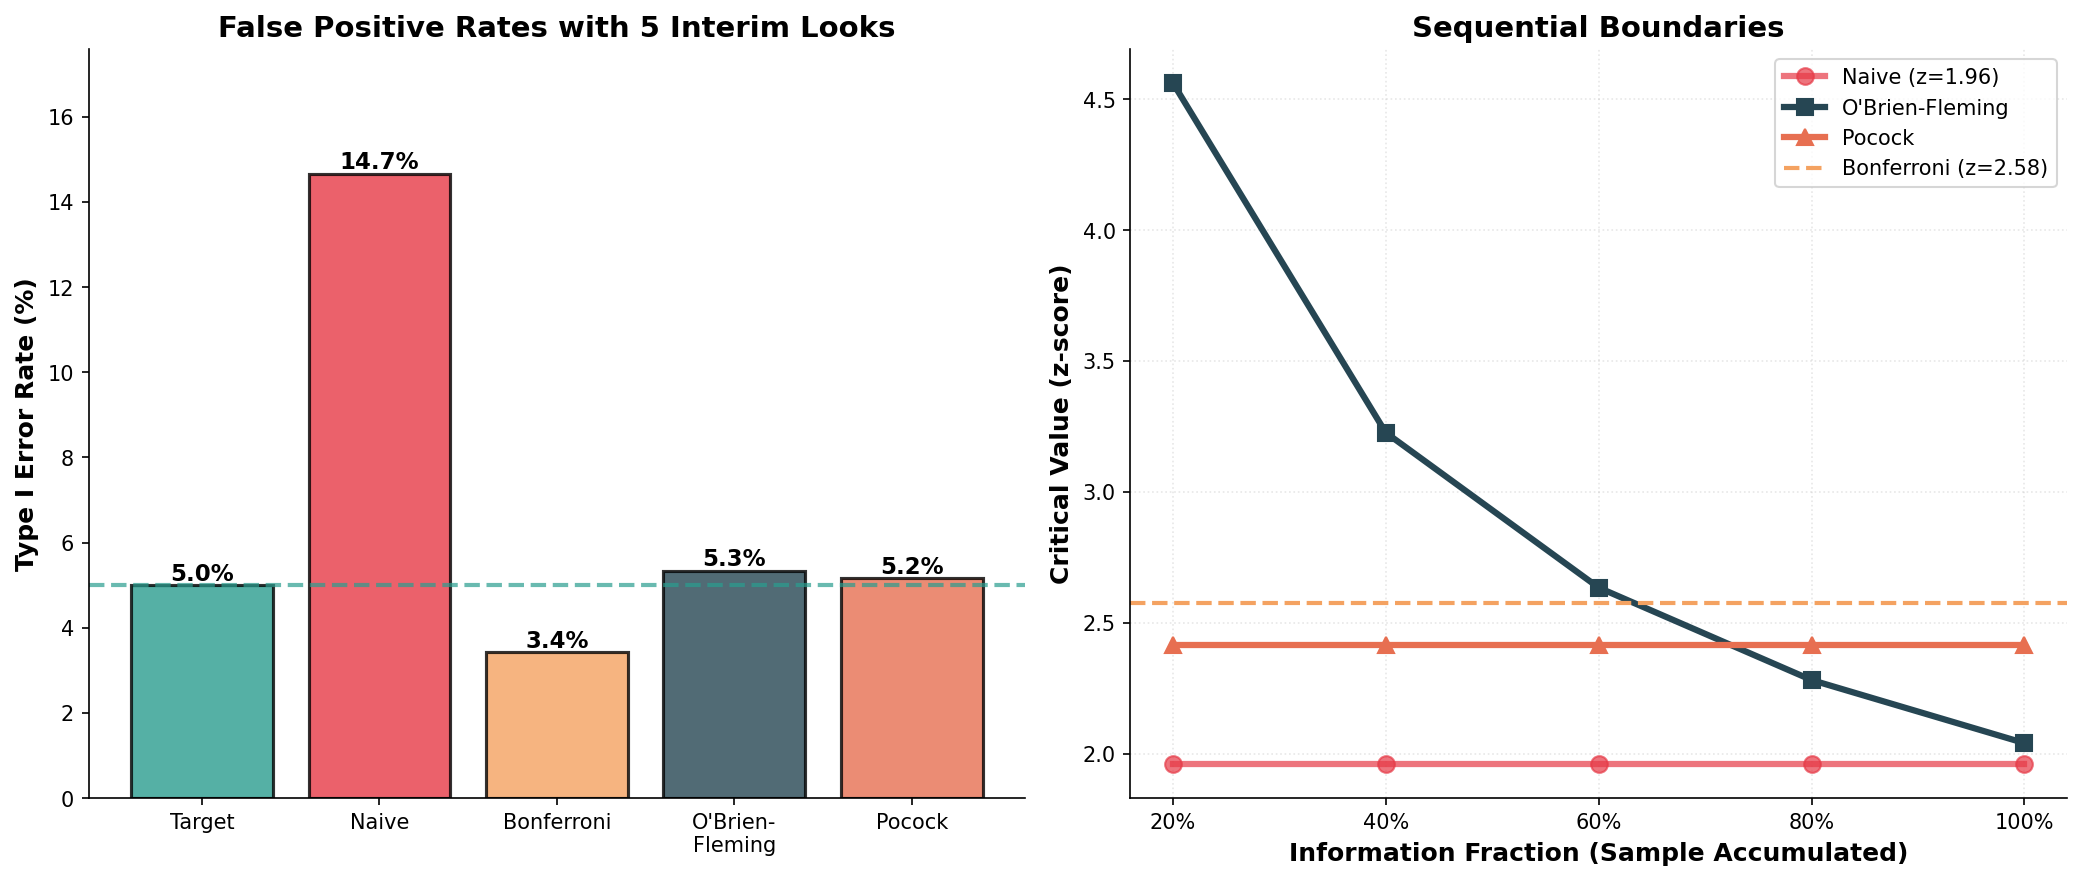
To quantify this, I ran 10,000 simulations of an experiment where the treatment had no real effect. Using a standard 1.96 z-score and peeking just five times produced a 14.7% false positive rate, nearly triple the acceptable risk.
The solution: sequential boundaries
Sequential testing fixes this using group sequential boundaries, which are adjusted critical values that change based on how much data you’ve collected. Instead of a fixed 1.96 threshold, these methods distribute your 5% error budget across every planned look.
O’Brien-Fleming is extremely conservative early on. The first of five looks requires a massive z-score of 4.562 to declare significance. The bar lowers as the test progresses, ending at 2.040. This approach held the false positive rate to approximately 5%.
Pocock sets a constant, higher hurdle of 2.413 at every check. This also successfully controlled risk at approximately 5%.
Choosing a strategy
Use O’Brien-Fleming if your default is to run experiments to completion. Because the early bar is so high, it’s nearly impossible to stop early for small effects, which preserves maximum statistical power for your final analysis. Testing a checkout redesign to detect a 2–3% conversion lift is a good example: OBF ensures you won’t kill the test prematurely unless there’s a catastrophic bug.
Use Pocock when early detection of large effects creates immediate business value. The uniform boundary enables symmetric early stopping, letting you confidently capture a home run or kill a dud at any stage. Testing a promotional banner during a four-week peak season is the case: if it’s driving a massive lift, scale it immediately; if it’s hurting conversions, stop it fast.
Takeaway
Stop using fixed-horizon z-tests for experiments if you plan to monitor results. By adopting O’Brien-Fleming or Pocock boundaries, you gain the ability to check results for safety and speed without inflating your false positive rate. If your experimentation platform doesn’t support sequential boundaries, you’re making decisions with inflated risk.

Senior data scientist and PhD economist specializing in experimentation and observational causal inference. Previously Uber, Airbnb, Stripe, the Federal Reserve, and the SEC. More about my background.
New write-ups when I finish them
I simulate a method, run it against known ground truth, and publish what happened. No schedule, and no filler between posts.
Unsubscribe anytime.