If you work in marketing data science, you know the frustration of walled-garden attribution. Whether you are running sponsored campaigns on Amazon, bidding on brand terms in Google Search, or running conversion ads on Meta, the platforms all share a common flaw: they default to greedy attribution windows, and they happily claim credit for organic sales that would have happened anyway.
In my last post I proved this was happening to my own e-commerce business. I ran a manual switchback experiment and used a marketing mix model to show that only ~53% of Amazon’s ad-attributed sales for my product were genuinely incremental. Because my product is a low-cost, $17 impulse purchase, organic cannibalization was rampant.
But identifying the problem is only half of data science; the other half is optimization.
I already rank well organically on the first page of search results for my top keywords. My hypothesis was that my top-of-page ad bids were simply cannibalizing my organic traffic. But I didn’t want to turn ads off entirely. If I slashed my bids by 50%, the ads would act as a cheaper safety net further down the search page, saving money by avoiding top-of-page cannibalization without sacrificing total revenue.
The challenge: marketplace A/B testing is broken
If you are a massive enterprise brand, you can pay for data clean rooms to run user-level holdout tests, or deploy complex geo-experiments. But for smaller brands, or anyone operating in a rigid marketplace like Amazon, standard A/B testing is impossible. You cannot randomize bids at the individual user level; every customer searching a specific keyword sees the exact same auction results.
When you can’t randomize users, you have to randomize time. I took the approach used by platforms like DoorDash and Lyft for marketplace testing: a daily switchback experiment. But toggling bids manually every day is prone to error and incredibly tedious, so I built a fully automated pipeline to execute the experiment, ingest the ground-truth data, and calculate the causal impact while I slept.
The experiment design
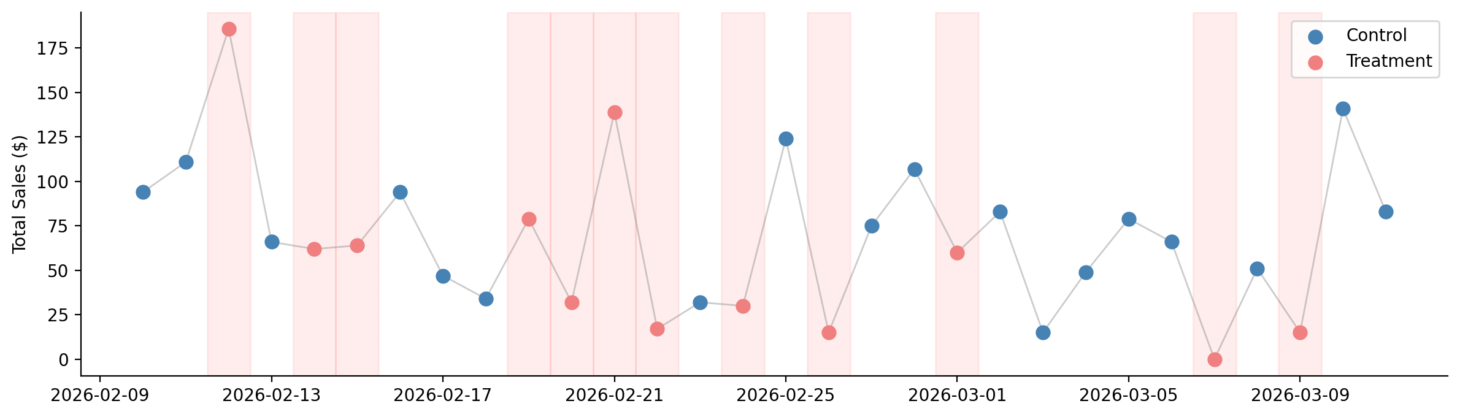
I designed a 30-day experiment testing my baseline bids against a 50% bid reduction. To keep the data clean, I paused the long tail of keywords entirely and isolated just 16 high-volume keywords, which accounted for 91% of my ad spend and nearly 100% of my ad-attributed sales prior to the experiment.
Every day for a month, from February 11 to March 11 2026, a randomized schedule determined whether those 16 keywords would run at baseline bids (control) or 50% reduced bids (treatment).
The tech stack
- Automation (GitHub Actions): every night just after midnight, a cron job ran a Python script to check the day’s randomized schedule.
- Executing the bids (Amazon Ads API): the script automatically pushed the required bid changes to the 16 keywords.
- Pulling the truth (Amazon SP-API): the script pinged the Selling Partner API to pull true total sales, organic plus paid, directly from Amazon’s order management system. This bypassed ad attribution entirely.
- The database (Supabase): stored in managed PostgreSQL, using idempotent upserts to continuously update Amazon’s rolling 7-to-30-day attribution windows as late-settling data arrived.
- The dashboard (Streamlit): a live, public-facing dashboard using statsmodels for OLS regression to track the experiment in real time.
The results: dramatically less spend, barely less revenue
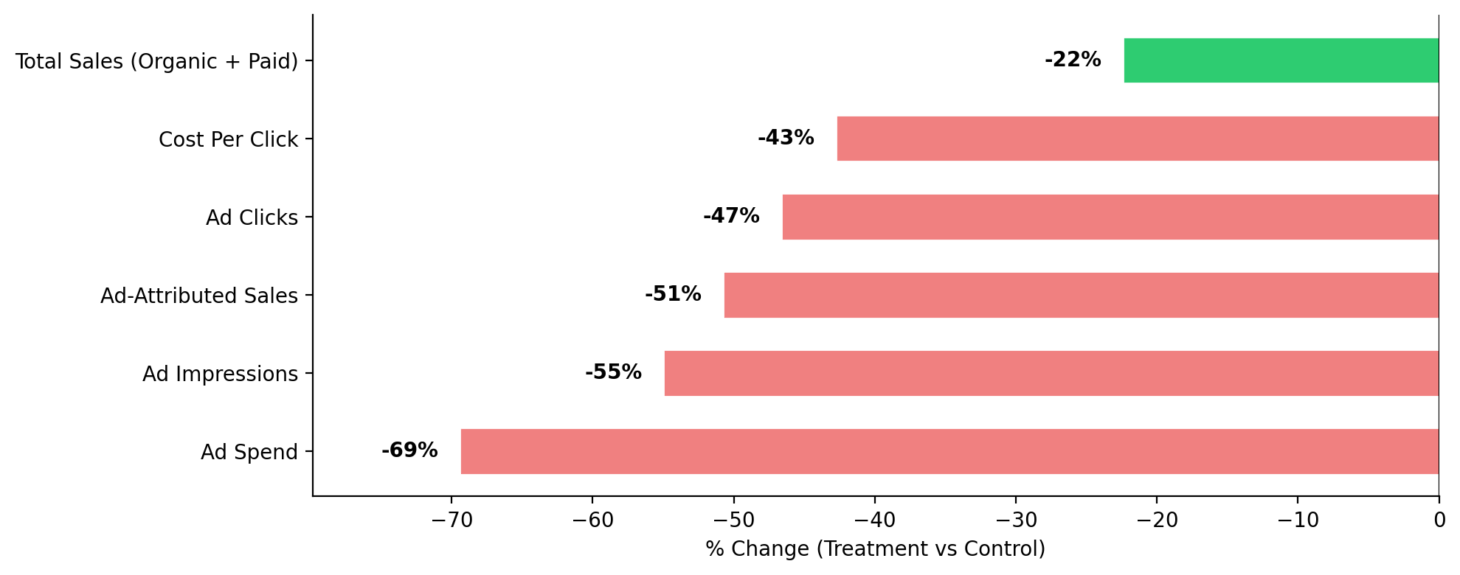
The drop in costs. Cutting bids by 50% successfully collapsed my ad costs. Daily ad spend dropped by 69%, saving roughly $21 per day. Impressions fell by 55%, and cost per click dropped by 43%.
The drop in sales. If you only looked at Amazon’s advertising dashboard, you would panic: ad-attributed sales fell by 51%. But because I built the SP-API integration, I wasn’t relying on Amazon’s dashboard. I was looking at ground-truth total revenue. Total sales only dropped by 22%, and statistically that drop wasn’t even significant (p=0.31).
The bottom line: profit margin math
The bid reduction worked exactly as intended. It gutted my ad spend, but total revenue was far less impacted, proving the safety net hypothesis. Buyers who wanted the product were still finding it, either organically on page 1 or further down the ad placements at a much cheaper cost per click.
Here is the only math that matters. My gross profit margin on these bracelets, after product costs, shipping, and Amazon referral fees, is roughly 50%. On treatment days I lost about $17 in total sales, meaning roughly $8.50 in gross profit. But on those same days I saved $21.32 in ad spend.
By losing $8.50 to save $21.32, the experiment proved that slashing bids yields a net profit benefit of $11 to $13 per day. Annualized, this single automated experiment generated roughly $3,866 to $4,715 in pure net profit. Lowering the bids permanently was a no-brainer.
Takeaways
- Testing beats trusting. Whether it is Google Search or Amazon, default attribution will always encourage you to spend more. You have to measure total sales to find your true incrementality.
- Lower bids can increase net profit. If you already rank well organically, high bids are likely just cannibalizing your organic traffic. Use lower bids as a safety net.
- Automation is accessible. You don’t need an enterprise data science team or clean-room access to do rigorous causal inference. With open-source tools and platform APIs, you can build marketplace experimentation pipelines to find the truth.

Senior data scientist and PhD economist specializing in experimentation and observational causal inference. Previously Uber, Airbnb, Stripe, the Federal Reserve, and the SEC. More about my background.
New write-ups when I finish them
I simulate a method, run it against known ground truth, and publish what happened. No schedule, and no filler between posts.
Unsubscribe anytime.